J J

Data in NBA/NCAA Basketball + Random Data

Read this first

Power Laws : Similarities in Reddit’s voting system and earthquakes.

A power law is the description for a variable which scales with the following function.
powerLaw.png
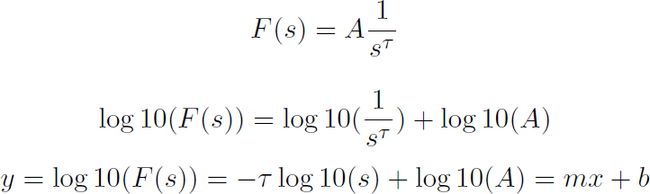
This mathematical function has many interesting properties but for now we will simply describe the mathematical function and interesting cases where this function is observed.

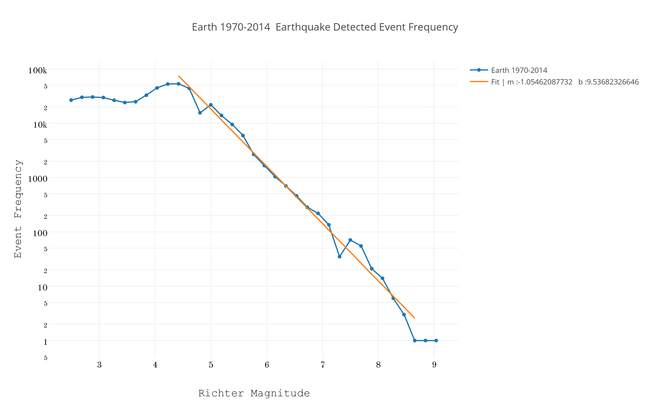
As observed by the last equation power laws will look linear in log-log axes. Many real world systems follow a power law but a famous example is that of the Gutenberg-Richter law in earthquakes. The following plot shows a histogram of earthquake data from 1970 to 2014 gathered by the US Geological Survey. There are deviations as seen in the initial roll off of small magnitude events but one does observe power law scaling for events larger than a 5.0 in the Richter scale. In this case the exponent tau is measured to be around one.
earth_1970-2014__earthquake_detected_event_frequency.png

What is interesting is how common such power laws can turn up in unexpected places. Reddit uses...

Continue reading →


Why Kevin Durant may be the most efficient scorer of active players in 2014? Distributions in NBA Scoring

In trying to analyze NBA data it is useful to know what the distributions look like for the metrics you are interested in analyzing. This exploratory data analysis is useful in seeing what the distribution for the points scored in a game for a given player. Histograms are a way of visualizing the frequency in which a metric like a given amount of points per games occurs. An example of this would be the histogram for points scored in a game for the point guard Goran Dragic.

goran_dragic_career_game_points__.png

From this histogram one sees that for Goran Dragic across his career he has been most likely to score in the high single digits. However a players minutes may change from game to game so maybe we should account for this by seeing what a players scoring rate was for a given game. To this end the amount of points scored in a game is divided by the amount of minutes played in the game. Lets see what the histogram looks...

Continue reading →